YAML Configuration Guide
ThingConnect Pulse uses a simple YAML file to define what devices to monitor and how to monitor them. This guide will help you create and manage your monitoring configuration.
Getting Started with YAML
YAML is a human-friendly configuration format. Here are the basics you need to know:
- Indentation matters - Use 2 spaces (not tabs)
- Lists start with a dash
- - Key-value pairs use a colon
: - Comments start with
#
Basic Configuration Structure
Every Pulse configuration has four main sections:
version: 1              # Configuration format version (always 1)

defaults:               # Default settings for all monitors
  interval_seconds: 30  # How often to check
  timeout_ms: 2000      # How long to wait for response
  retries: 1            # Number of retry attempts

groups:                 # Organize your devices into groups
  - id: servers
    name: "Server Room"

targets:                # The actual devices to monitor
  - name: "Main Server"
    host: "192.168.1.10"
    type: icmp
    group: servers
Step-by-Step Configuration
Step 1: Define Your Groups
Groups help organize your monitored devices. Think of them as folders for your devices:
groups:
  - id: production
    name: "Production Floor"

  - id: office
    name: "Office Network"

  - id: critical
    name: "Critical Systems"
    color: "#FF0000"  # Red color in dashboard
Tips:
- Use meaningful group names that match your organization
- Groups can have colors to make them stand out in the dashboard
- Keep group IDs simple (lowercase, no spaces)
Step 2: Set Your Defaults
These settings apply to all monitors unless you override them:
defaults:
  interval_seconds: 60   # Check every minute
  timeout_ms: 3000       # Wait up to 3 seconds
  retries: 2             # Try twice before marking as down
Recommended defaults:
- Critical devices: 30-second intervals, 2-second timeout
- Standard devices: 60-second intervals, 3-second timeout
- Non-critical: 300-second intervals, 5-second timeout
Step 3: Add Your Devices
Now add the devices you want to monitor:
Simple Ping Monitoring (ICMP)
Perfect for checking if a device is reachable:
targets:
  - name: "Gateway Router"
    host: "192.168.1.1"
    type: icmp
    group: critical
    interval_seconds: 30  # Override default for this device
Port Monitoring (TCP)
Check if specific services are running:
targets:
  - name: "Database Server"
    host: "db.company.local"
    type: tcp
    port: 5432  # PostgreSQL port
    group: servers

  - name: "Remote Desktop"
    host: "10.0.0.50"
    type: tcp
    port: 3389
    group: office
Web Service Monitoring (HTTP)
Monitor websites and web applications:
targets:
  - name: "Company Website"
    host: "www.company.local"
    type: http
    http_path: "/"
    group: critical

  - name: "API Health Check"
    host: "api.company.local"
    type: http
    http_path: "/health"
    http_match: "OK"  # Expect "OK" in response
    group: production
Monitoring Multiple Devices
Using IP Ranges (CIDR)
Monitor an entire subnet with one configuration:
targets:
  - name: "Production Machines"
    cidr: "192.168.10.0/24"  # Monitors 192.168.10.1 to 192.168.10.254
    type: icmp
    group: production
    interval_seconds: 120
Using Wildcards
Monitor a specific range of IPs:
targets:
  - name: "Office Printers"
    wildcard: "192.168.1.*"  # Monitors 192.168.1.1 to 192.168.1.254
    type: tcp
    port: 9100  # Printer port
    group: office
Complete Example
Here's a real-world configuration for a small manufacturing facility:
version: 1

defaults:
  interval_seconds: 60
  timeout_ms: 3000
  retries: 1

groups:
  - id: network
    name: "Network Infrastructure"
    color: "#0080FF"

  - id: production
    name: "Production Systems"
    color: "#00FF00"

  - id: office
    name: "Office & Admin"
    color: "#808080"

  - id: security
    name: "Security Systems"
    color: "#FF0000"

targets:
  # Network Infrastructure
  - name: "Main Gateway"
    host: "192.168.1.1"
    type: icmp
    group: network
    interval_seconds: 30  # Check more frequently

  - name: "Core Switch"
    host: "192.168.1.2"
    type: tcp
    port: 22  # SSH port
    group: network

  # Production Systems
  - name: "PLC Network"
    cidr: "192.168.100.0/24"
    type: icmp
    group: production
    interval_seconds: 120

  - name: "HMI Panel 1"
    host: "192.168.100.10"
    type: tcp
    port: 5900  # VNC port
    group: production

  - name: "SCADA Server"
    host: "scada.factory.local"
    type: http
    http_path: "/status"
    http_match: "RUNNING"
    group: production
    interval_seconds: 30

  # Office Systems
  - name: "File Server"
    host: "files.company.local"
    type: tcp
    port: 445  # SMB port
    group: office

  - name: "Printer Network"
    wildcard: "192.168.2.*"
    type: tcp
    port: 9100
    group: office
    interval_seconds: 300  # Check every 5 minutes

  # Security Systems
  - name: "Camera NVR"
    host: "192.168.50.1"
    type: tcp
    port: 8000
    group: security

  - name: "Access Control"
    host: "192.168.50.10"
    type: http
    http_path: "/api/status"
    group: security
Applying Your Configuration
- Navigate to the Configuration page in the web interface
- Click "Edit Configuration"
- Paste your YAML configuration
- Click "Apply Configuration"
- Review the validation results
- Confirm to start monitoring
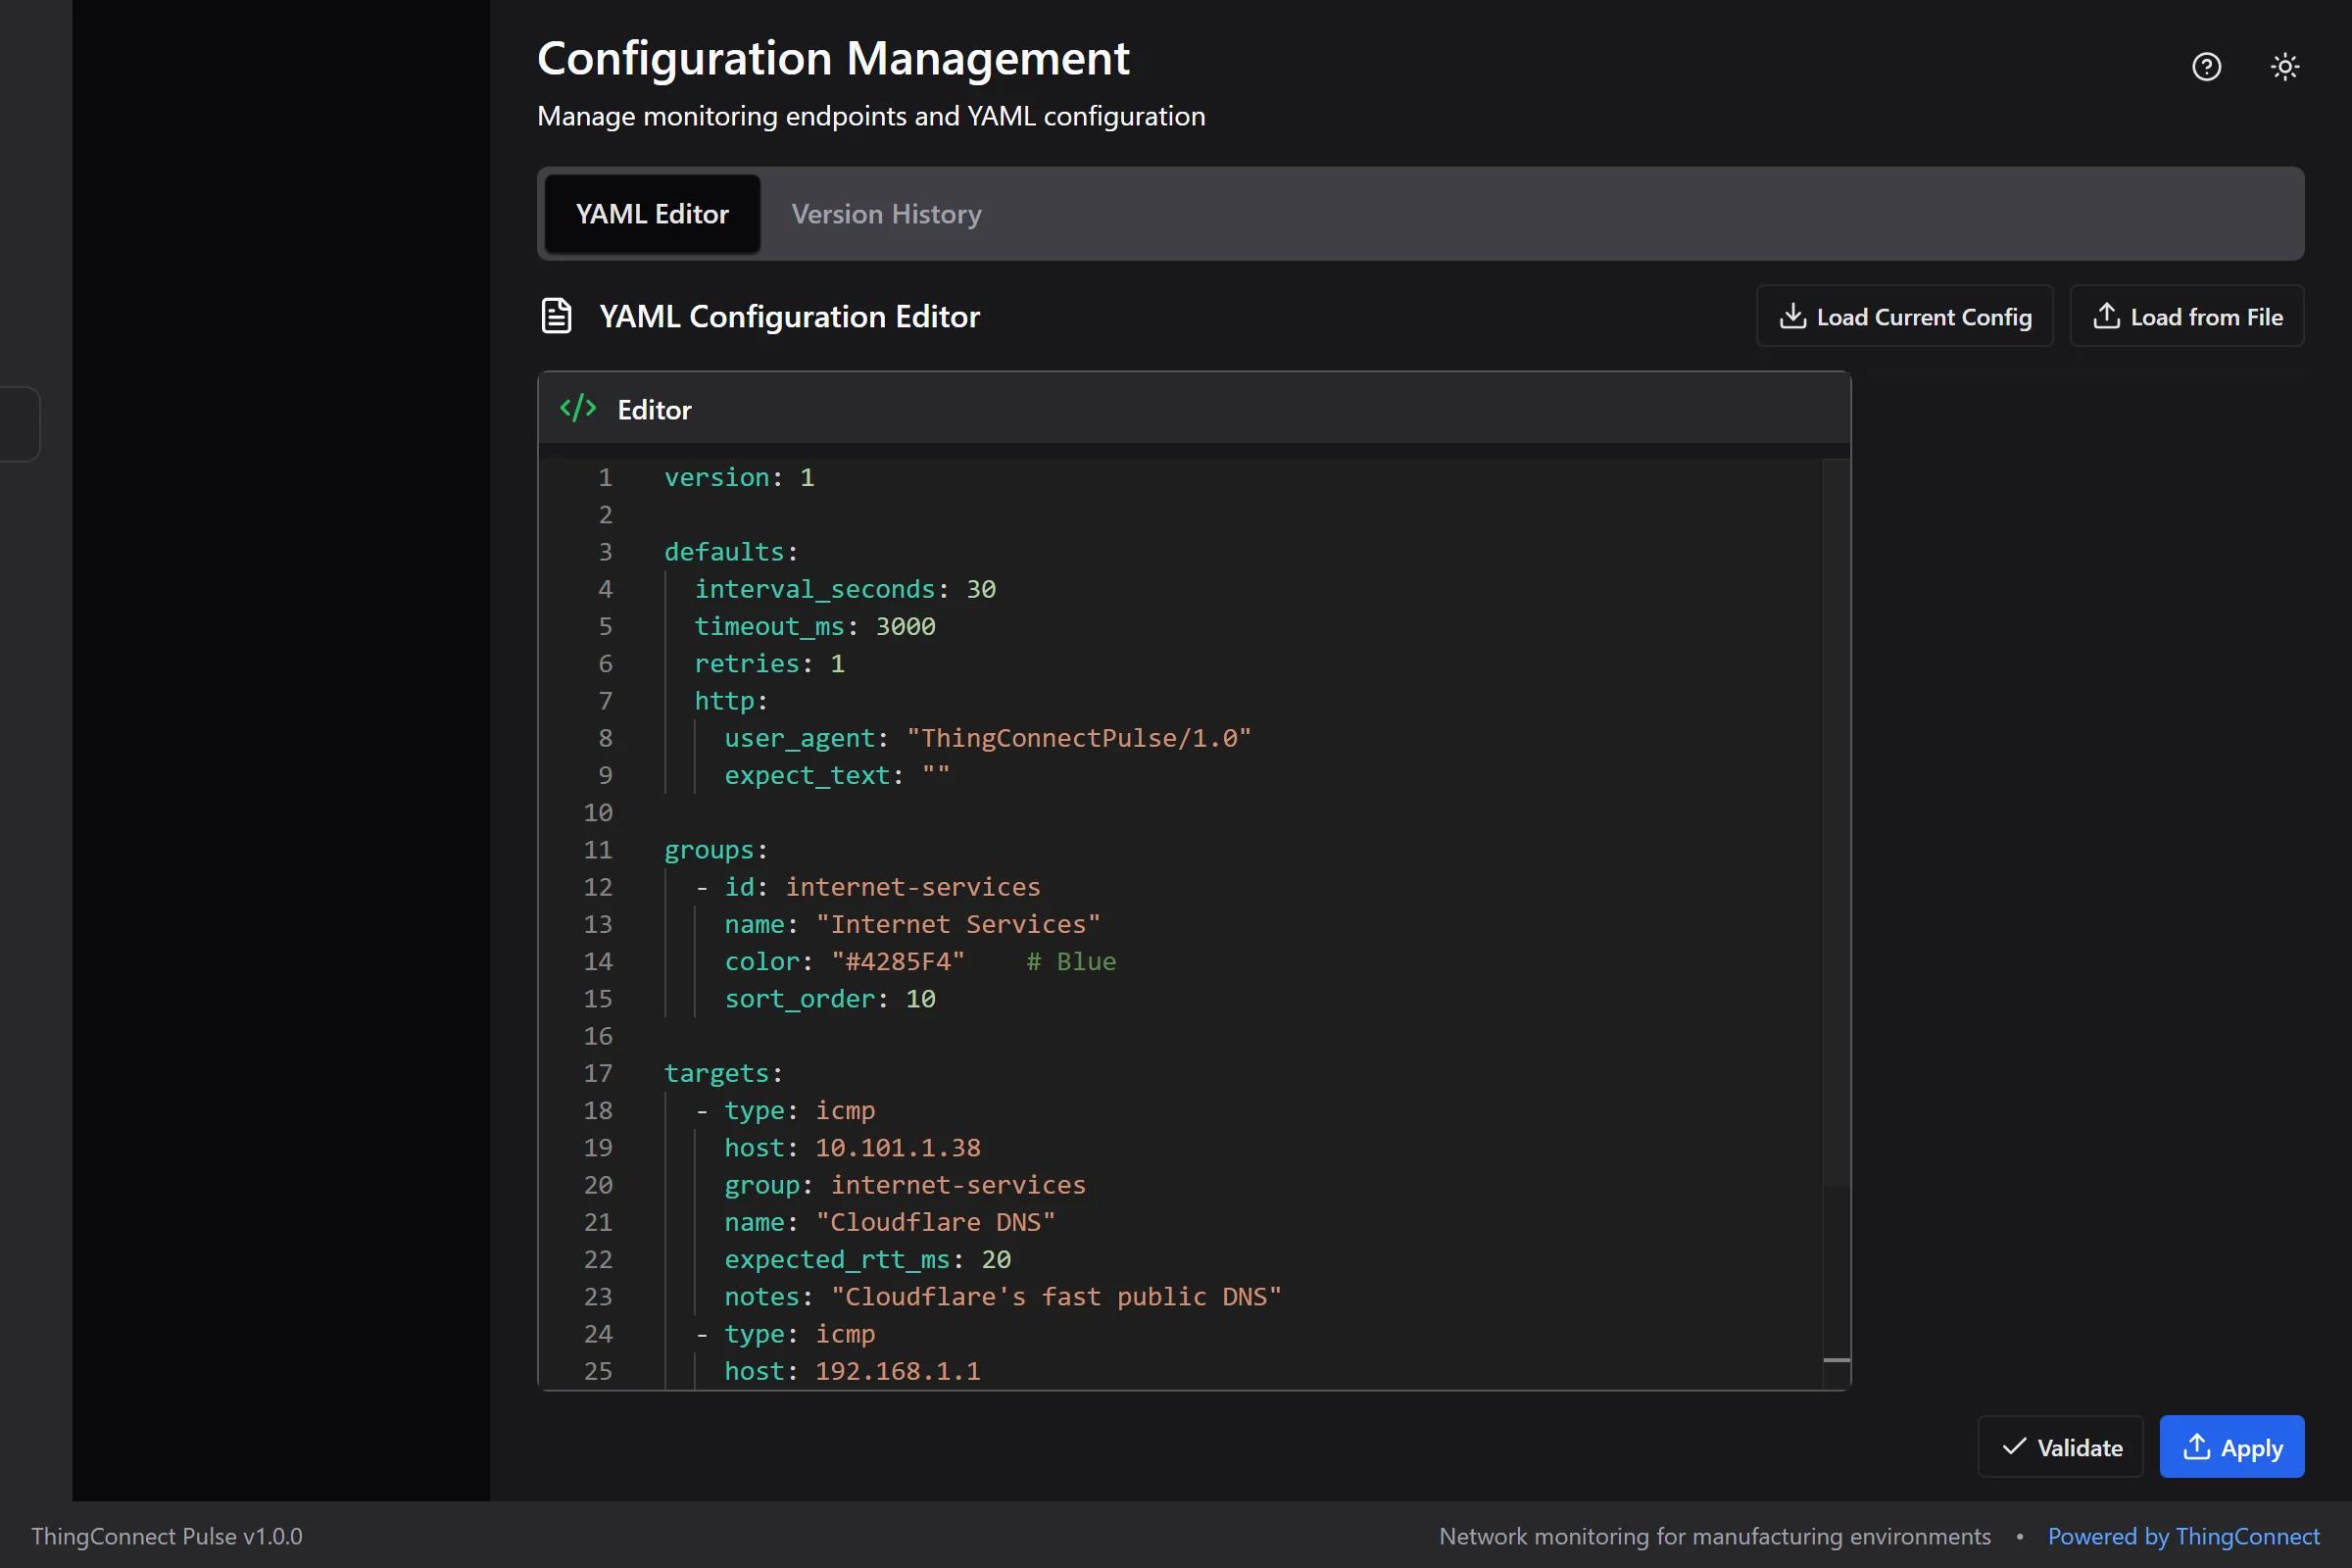
The configuration editor provides syntax highlighting, validation, and helpful documentation panels to guide you through creating your monitoring setup.
Configuration Tips
- Start small - Add a few devices first, then expand
- Use descriptive names that anyone can understand
- Group devices logically by location or function
- Test your configuration with a dry run first
- Keep a backup of working configurations
- Don't set intervals too low (under 30 seconds) for non-critical devices
- Don't monitor unnecessary ports or services
- Don't use overly broad CIDR ranges (/16 or larger)
- Don't forget to set appropriate timeouts for slow devices
Troubleshooting
Common Issues:
"Invalid YAML syntax"
- Check indentation (use 2 spaces, not tabs)
- Ensure all strings with special characters are in quotes
- Look for missing colons or dashes
"Group not found"
- Make sure the group ID in targets matches exactly with the groups section
- Group IDs are case-sensitive
"Validation failed"
- Required fields: version, defaults, groups, targets
- Each target needs: type, group, and one of (host/cidr/wildcard)
- TCP targets also need a port number
"No devices discovered"
- Check that IP ranges are correct
- Ensure devices are reachable from the Pulse server
- Verify network firewalls allow monitoring traffic
Advanced Options
Custom Timing per Device
Override defaults for specific devices:
targets:
  - name: "Slow Remote Site"
    host: "remote.company.com"
    type: icmp
    group: network
    interval_seconds: 300    # Check every 5 minutes
    timeout_ms: 10000        # Wait up to 10 seconds
    retries: 3               # Try 3 times
Disable Monitoring Temporarily
Set enabled: false to pause monitoring without removing the configuration:
targets:
  - name: "Test Server"
    host: "192.168.1.99"
    type: icmp
    group: office
    enabled: false  # Temporarily disabled
Add Notes
Document special configurations or requirements:
targets:
  - name: "Legacy System"
    host: "10.0.0.5"
    type: tcp
    port: 23  # Telnet
    group: production
    notes: "Old PLC - requires 10 second timeout due to slow response"
    timeout_ms: 10000
Next Steps
- Live Board and History: View your monitoring data
- Troubleshooting: Resolve common issues
- API Reference: Automate configuration updates